Charts Explained
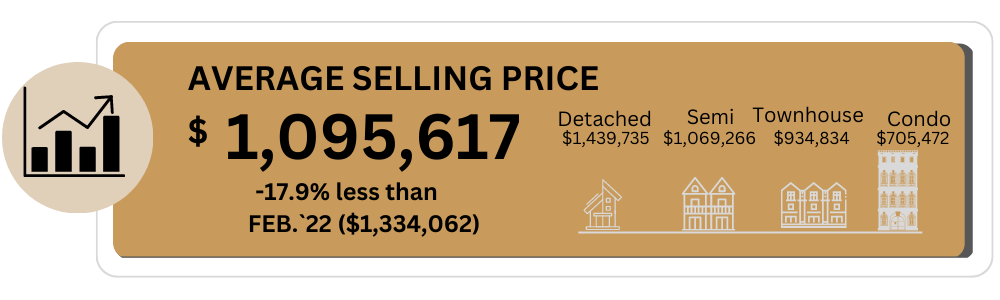
The initial chart illustrates the decrease in home prices in the Greater Toronto Area (GTA) since February of last year. Home prices have dropped by almost 18%, with Toronto experiencing a slightly lower decline of 14%. This decrease in prices has affected all housing types, with detached homes experiencing the most significant drop of nearly 20%, while condos have had a milder decline of 11%.
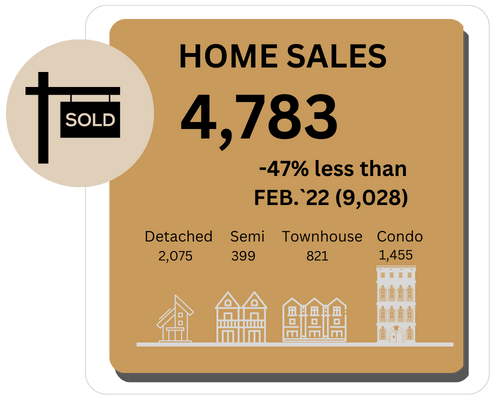
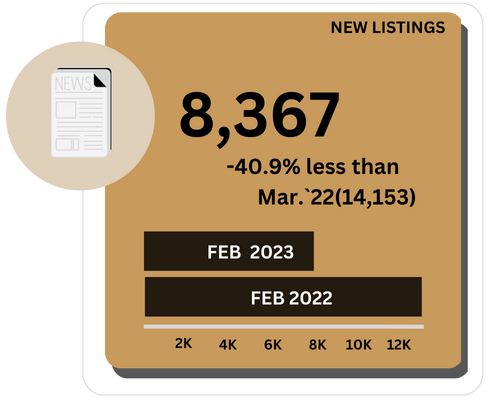
The second and third charts depict sales and new listings, respectively. Sales volume has decreased by almost 50% compared to last year due to higher interest rates, which has led to fewer buyers competing in the market. This has put pressure on prices and reduced competition among buyers. The third chart shows a downward trend in new listings, indicating that sellers are not desperate to sell their properties. This may be because many recent homeowners bought their homes when the stress test was in effect, qualifying them at 5% rates, and they should be able to afford their homes even if their rates increase. It is worth noting that over a third of buyers in Ontario opt for variable rates, but there is no significant sales activity from this group.
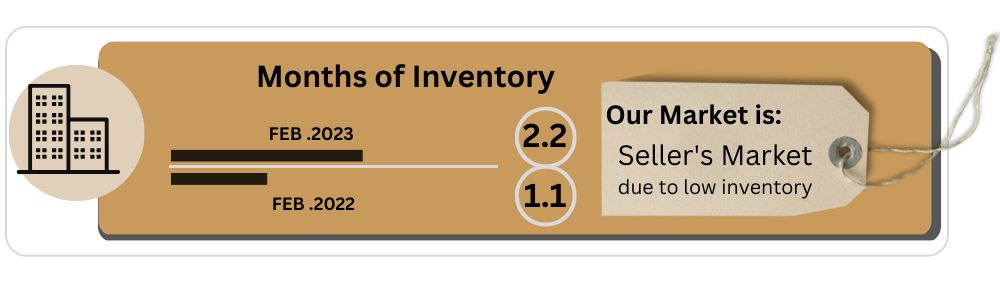
The last graph shows Months-of-Inventory, which is a key metric to tell us if this market is a buyer's market or a seller's market. Remember, that months of inventory are based on how long the current inventory will deplete if no new listings come to market. Given, we have a number under 4 months, we see that it is a seller's market with 2.2 months of inventory. It was a strong seller's market before with 1.1 months of inventory so we are seeing the shift take place but not fast enough given low inventory levels.
During these high-interest times, think short-term with the rate you buy, and focus long-term on the house. If the right home comes up, and the numbers make sense - Go for it! Leave a buffer for maintenance, taxes, utilities, and emergencies. Once rates go lower, then refinance and watch your equity grow!
Rental Market
There is a growing trend of landlords asking their tenants to vacate their rental units so they can adjust their rental rates to match current market prices. Due to the impact of the COVID-19 pandemic, many leases were signed at approximately 20% below current rental prices. However, with increasing demand for rental units due to rising immigration rates, prices are on the rise. As a result, we are observing a significant increase in the cost of all types of rental units (houses, condos, and even basements). For renters, we recommend budgeting for these increases in case you are out looking for a new lease.
Foreign Buyer Ban Affects
As someone who, along with my colleagues, is actively involved in buying and selling real estate in 2023, the ban on foreign buyers appears to have had little impact on the resale market. Despite the ban, there are still property shortages and bidding wars taking place in various pockets and price ranges. In particular, neighborhoods with good school districts with homes priced between $900,000 and $1.2 million are seeing the most activity, with some experiencing bidding wars of 4 to 6 offers on offer nights. It seems that overall, the limited inventory and higher interest rates are having a greater impact than the ban on foreign buyers.
Check out MoRealtyTeam.com for more details! |
 Welcome [FirstName] to your March Newsletter!!